

This article describes transmission characteristics, which indicate whether signals are properly transmitted. Transmission characteristics are specifically clarified based on the following terms.
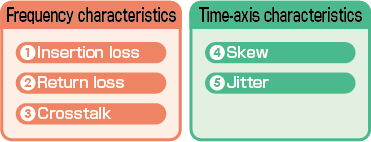
Transmission characteristics are broadly classified into two categories.
Terms (1) to (3) indicate transmission characteristics along the frequency-axis, while terms (4) and (5) indicate transmission characteristics along the time axis.
Many of you may have actually seen these terms in the evaluation results of transmission characteristics. In order to correctly grasp the evaluated results, let's properly understand the meaning of each term.
Terms (1) to (3) of the frequency characteristics will be explained in this article.
(1) Insertion loss
Indicates how much of the input signal was attenuated at the output.
(2) Return loss
Indicates how much of the input signal was reflected back to the input side without reaching the output.
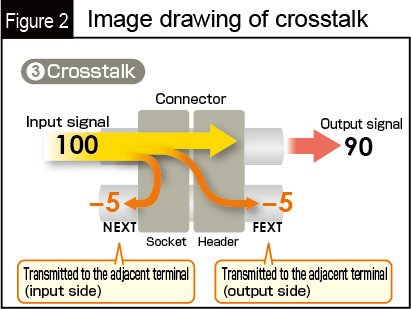
(3) Crosstalk
Indicates how much of the differentially transmitted signal was unintentionally transmitted to adjacent terminals.
The signal component transmitted to the input side terminal is referred to as Near End Cross Talk (NEXT), while the signal component transmitted to the output side terminal is referred to as Far End Cross Talk (FEXT).
These characteristics are used for determining whether the transmission performance in question is good and are represented in such graphs as shown below.
These evaluation results are referred to as S-parameters.
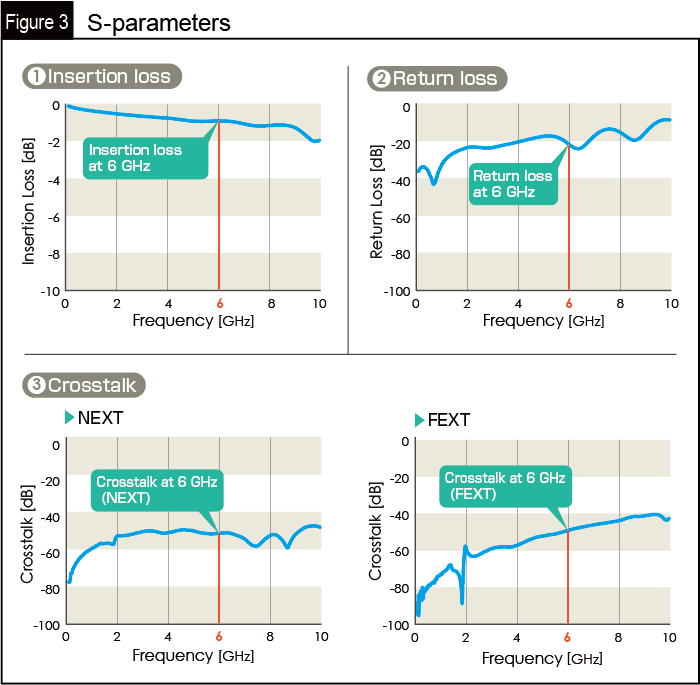
The following summarizes key points in interpreting these graphs.
• Each horizontal axis shows signal frequencies in GHz.
• Each vertical axis shows the attenuation of transmission signals in dB.
→The lower the values plotted in the graph,
①Insertion loss: the higher the signal attenuation
②Return loss: the lower the signal reflection
③Crosstalk: the lower the transmission penalty.
For example, when data are transmitted at 6 GHz, each graph allows you to check the attenuation or transfer penalty of signals by reading the dB value of each graph's characteristic line at 6 GHz on the horizontal axis.
In addition, when data are transmitted at various frequencies and if such a graph shows flat characteristics, then you can confirm that the attenuation does not change much with varying frequencies.
Individual transmission standards specify the tolerance of these S-parameter values, which must be satisfied.
Panasonic provides the evaluation results of each connector's S-parameters in response to customer demand.
If you wish to request such data, please use the Contact Us link.
Contact Us (https://www3.panasonic.biz/ac/e/user/new_question/index.jsp)
How were the above explanations?
This article explained frequency characteristics as part of transmission characteristics essential for evaluating the performance of signal transmission. As a follow-up, another article will explain skews and jitter that indicate time-axis transmission characteristics.


